Quick Gantt Chart tutorials
Follow a written example with sample files, or choose a video for the task you want to complete.
Import Excel tasks and share a PDF schedule
If your task list is already in a spreadsheet, you can import it into Quick Gantt Chart, check the schedule and export a PDF for someone who only needs to read it. This example takes four tasks from an Excel worksheet to a finished schedule.
Download the import and PDF example (ZIP, 43 KB). It contains the Excel file, the editable .gnt project, the exported PDF and instructions. Extract the ZIP before opening the files.
Prepare a small task table
Use one header row and one task per row. This example has three columns: Task Name, Start Date and Finish Date. In your own workbook, use actual Excel date values and display them consistently, for example as 2026-10-05 08:00.
| Task | Start | Finish |
|---|---|---|
| Scope planning | 5 Oct | 6 Oct |
| Create draft | 7 Oct | 9 Oct |
| Review | 12 Oct | 13 Oct |
| Publish | 14 Oct | 14 Oct |
Each task starts at 08:00 and finishes at 16:00 on its listed dates. The example uses Monday–Friday working hours, 08:00–16:00, with no holidays, dependencies or resources. Its durations are 16, 24, 16 and 8 working hours. Different working-time rules can change those durations.
Check the range, mapping and validation
- Start with a new, empty project. Choose File > Import and select the downloaded XLSX file.
- On Select Data, check the Tasks worksheet and range A1:C5. Keep Selection includes header row checked. The preview should report four data rows and three columns.
- On Map Columns, confirm that Task Name, Start Date and Finish Date map to the corresponding task fields. These headers are detected automatically in the example.
- On Validate, select Validate Data. The example passes with four valid rows and zero invalid rows using en-US and no custom date format. For your own file, inspect errors and check the locale or date format before continuing.
- On Import, keep Append to existing project and select Finish. Check the four tasks and their dates, then use File > Save As to save an editable .gnt project.
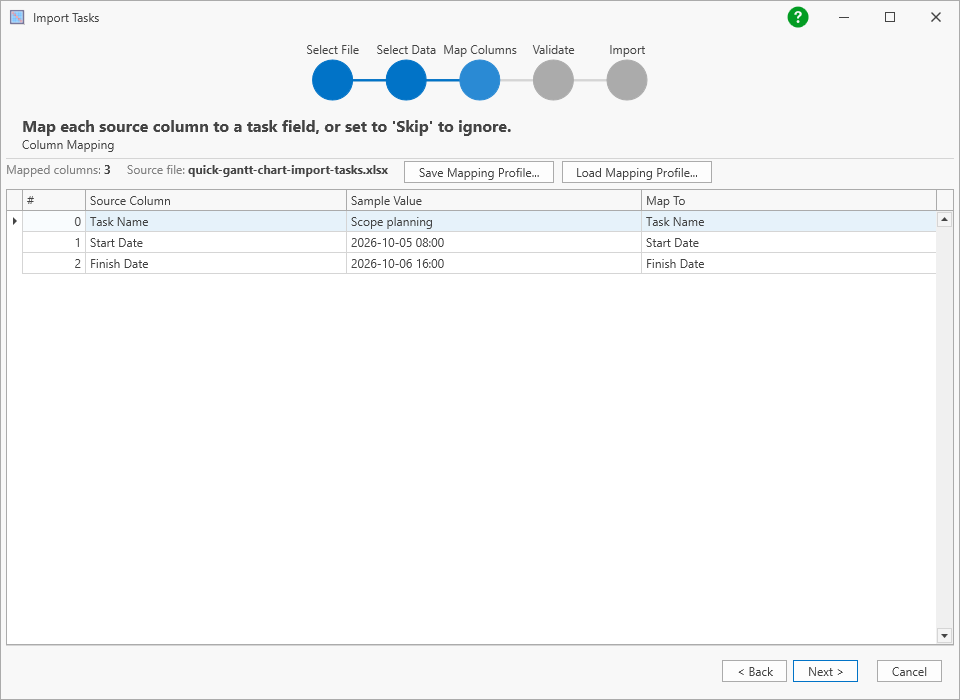
Append adds tasks to whatever is already open. Importing the same file again adds another set, so use a fresh project when repeating this exercise. The importer requires a task name and at least two of Start Date, Finish Date and Duration. The supplied example uses both dates.
Export a readable PDF
- Choose Quick Export > Export To PDF. Select Tree And Gantt Chart to include the task table and the bars.
- Expand more options. For this example, use Landscape and enable Fit To One Page. The supplied PDF keeps As displayed colors.
- Check the date range. To reproduce the example, clear Default under Export Date Range and choose 4–18 October 2026 in the calendars. Both boundaries fall on Sundays outside this project’s working hours. The included instructions record the exact settings.
- Select Ok, choose a PDF filename and save. Open the PDF and check task names, dates, the time scale and any page breaks.
Fit To One Page fits the output to one page wide. A long task list can still continue onto more pages vertically. The current chart zoom also affects the output. If text becomes too small or a date heading is cut off, review the zoom and date range, then export again.

Keep the editable project as well
Use the .gnt project for further changes and the PDF to share a snapshot. The PDF does not update when the schedule changes. To compare later revisions with an agreed plan, continue with the baseline guide.
Example checked in Quick Gantt Chart 1.0.97.0 for Windows. All tasks and dates are fictional.
Build a schedule with resource costs
Follow a complete website launch project, trace a task budget back to hours and rates, and see what one extra working day changes. The worked example includes two editable projects and a real PDF export.
Compare your schedule with a baseline
A project schedule changes as work progresses. A baseline keeps the planned start and finish dates available for comparison, so you can see how the current schedule differs from the plan you saved.
Save and display the planned dates
- Open your project in the Gantt view and check the start and finish dates of the tasks you want to compare.
- Select the plus button beside Baseline. Enter a name you will recognize later, such as “Approved plan – 5 Oct”, and confirm it.
- Open the Baseline selector, choose your named baseline and select OK. Creating a baseline and selecting it for display are separate steps.
The baseline captures tasks that have both a start date and a finish date when you create it. If a task has no comparison bar, check whether both dates were present at that point.
Try a small schedule change
Use a separate example project with two tasks and no dependencies. Start with these dates, then create and select a baseline:
| Task | Planned start | Planned finish |
|---|---|---|
| Draft copy | 5 October | 6 October |
| Review | 7 October | 8 October |
- Select Review and open Task Settings.
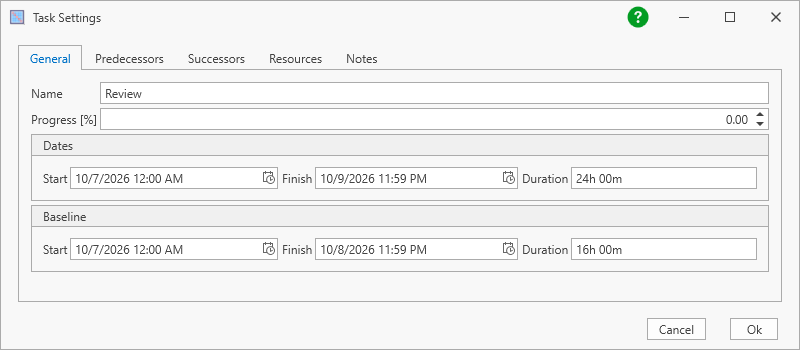
- In the Dates section, open the Finish calendar and choose 9 October 2026. Keep the time unchanged and confirm the calendar, then the task settings. Leave the dates in the Baseline section unchanged.
- Compare the bars, or reopen Task Settings. The current finish is now 9 October; the baseline finish remains 8 October.
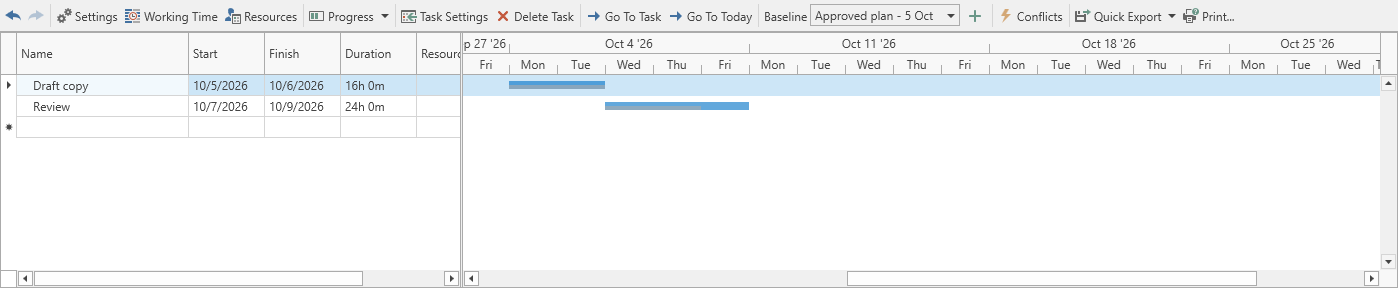
Download the baseline example (ZIP, 2 KB). It includes the completed .gnt project, the original CSV and instructions. Open the .gnt file in Quick Gantt Chart to explore the comparison, or import the CSV into a new project to try the steps yourself.
In a real project, dependencies and working-time settings can also affect task dates. Check the resulting schedule after editing it.
Keep comparisons meaningful
Use Manage Baselines from the selector to rename or remove saved baselines. If a revised plan is agreed, create another baseline with a distinct name so you can choose the comparison you need.
Selecting No Baseline hides the comparison. It does not move your current tasks back to their previous dates. A baseline stores planned task dates; keep normal copies of the complete project as well.
For more answers, see the Quick Gantt Chart FAQ. The video below also demonstrates working with baselines.
Video tutorials
Watch on this page after choosing the required cookies, or use the direct YouTube links.
01. App overview
1:23
An introduction to Quick Gantt Chart for Windows, showing its project planning interface and the main tools for working with a Gantt chart.
To watch here, enable Functional, Analytics and Advertisement cookies in Cookie preferences, or use the YouTube link.
02. Tasks, milestones and dependencies
4:24
Learn how to create and edit tasks in Quick Gantt Chart for Windows and organize them in a project schedule.
To watch here, enable Functional, Analytics and Advertisement cookies in Cookie preferences, or use the YouTube link.
03. Dependency types
2:54
Learn how to connect tasks with dependency links in Quick Gantt Chart and use those relationships to plan a project schedule.
To watch here, enable Functional, Analytics and Advertisement cookies in Cookie preferences, or use the YouTube link.
04. Managing resources
3:12
Learn how to work with resources in Quick Gantt Chart and assign them to tasks in a project.
To watch here, enable Functional, Analytics and Advertisement cookies in Cookie preferences, or use the YouTube link.
05. Tracking progress with baselines
1:49
Learn to save initial, revised and approved baselines in Quick Gantt Chart, switch between them to compare schedule changes, and rename or remove saved baselines. Baselines are visual references and do not change the active schedule.
To watch here, enable Functional, Analytics and Advertisement cookies in Cookie preferences, or use the YouTube link.
06. Budgets and costs
3:10
Learn how to work with project budgets in Quick Gantt Chart, including planned and actual task costs.
To watch here, enable Functional, Analytics and Advertisement cookies in Cookie preferences, or use the YouTube link.
Need a hand?
Find an answer in the Quick Gantt Chart FAQ or contact support.