QUICK GANTT CHART
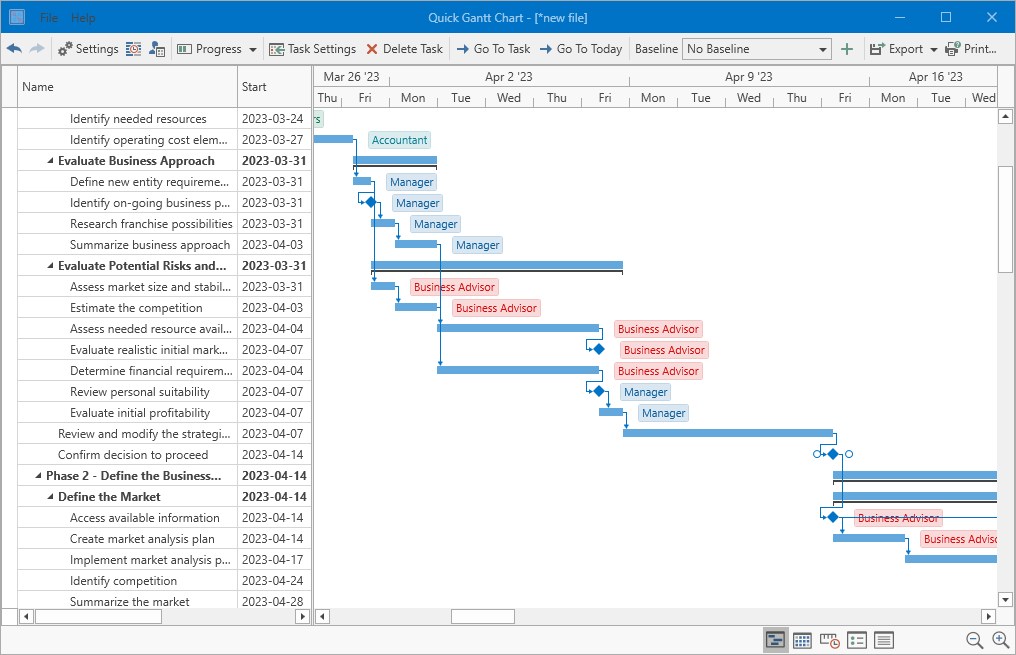
With our app, you can create professional and detailed Gantt charts that will take your project management skills to the next level.
Quick Gantt Chart offers a wide range of features, including interactive editing, auto scheduling, critical paths, baselines, and export to many formats. You can customize your Gantt chart to meet your needs, and the auto-scheduling feature will help you save time by automatically updating your project plan based on changes you make.
The critical path feature will allow you to identify the most critical tasks and ensure that your project stays on track, while the baseline feature will help you compare your current progress against your original plan. You can also export your Gantt chart to many formats, including PDF, Excel, and PNG, so you can easily share it with your team.
Whether you’re managing a large project or a small one, the Quick Gantt Chart app is the perfect tool to help you stay organized and on track.

FEATURES
Interactive Editing

You can drag and resize tasks to change start dates and durations, modify progress, and attach or detach connectors to define dependency links.
Resources

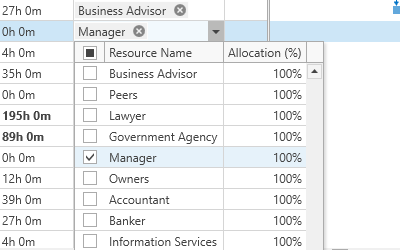
You can assign resources to tasks. Resources can be people responsible for tasks, equipment, and materials. You can also specify the percentage of time a resource spends on a task.
Auto Scheduling & Critical Path

If there are changes in dates and timelines of your tasks or in dependencies between them, program will recalculate everything automatically
Baselines

Compare original timeline projections with the actual timeline of the project.
Custom working days

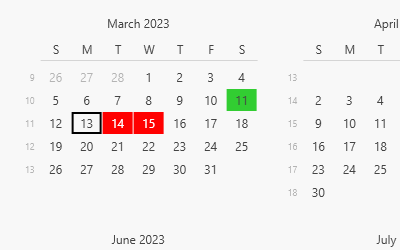
You can customize your projects setting personal working days and days-off. Quick Gantt Chart will automatically calculate the duration of your project based on your business calendar.
Export

Export your timeline to the most popular formats like PDF, PNG, XLSX, and DOCX.
ABOUT GANTT CHARTS
Gantt charts are a type of project management tool that is used to visualize the timeline of a project. They are named after Henry Gantt, an American engineer who developed the chart in the early 20th century. Gantt charts are widely used in a variety of industries, from construction to software development, to help project managers plan, schedule, and track their work.
A Gantt chart is a horizontal bar chart that shows the start and end dates of each task in a project. The chart is divided into columns, with each column representing a specific time period, such as a day, week, or month. The tasks are represented as bars on the chart, with the length of each bar representing the duration of the task.
One of the key benefits of using a Gantt chart is that it allows project managers to easily see the timeline of a project and how different tasks are connected. By visualizing the project timeline, project managers can identify potential scheduling conflicts, track progress, and make adjustments to the project plan as needed.
Here are some tips for creating effective Gantt charts:
- Identify the project tasks: The first step in creating a Gantt chart is to identify all of the tasks that need to be completed as part of the project. This can be done by breaking down the project into smaller, more manageable tasks.
- Determine the task dependencies: Once you have identified the project tasks, it’s important to determine the dependencies between the tasks. This means identifying which tasks need to be completed before others can start.
- Assign task durations: Next, assign a duration to each task. This can be done based on past experience or by consulting with team members who will be responsible for completing the tasks.
- Create the Gantt chart: Create the Gantt chart by adding each task as a bar on the chart. Make sure to include the start and end dates for each task and any dependencies between tasks.
- Update the Gantt chart regularly: As the project progresses, it’s important to update the Gantt chart regularly to reflect any changes in the project timeline or task durations. This will help to ensure that the project stays on track and that everyone is aware of any changes to the project plan.
Gantt charts are a valuable tool for project managers to plan, schedule, and track their work. By visualizing the project timeline and task dependencies, project managers can identify potential issues and make adjustments to the project plan as needed. With Quick Gannt Chart you can create effective Gantt charts that help you to manage your projects more efficiently.

