Sankey Diagram tutorials
Create your first diagram, refresh a recurring report, or turn complete records into flows across stages. Each tutorial follows one practical task from input to result.
3 video tutorials · English narration and visible English captions · About 8 minutes in total
Video tutorials
Choose your cookie preferences to watch here, or use a direct YouTube link. Only the tutorial you select loads a player.
01. Create your first diagram from Excel
2:34 · English narration and captions
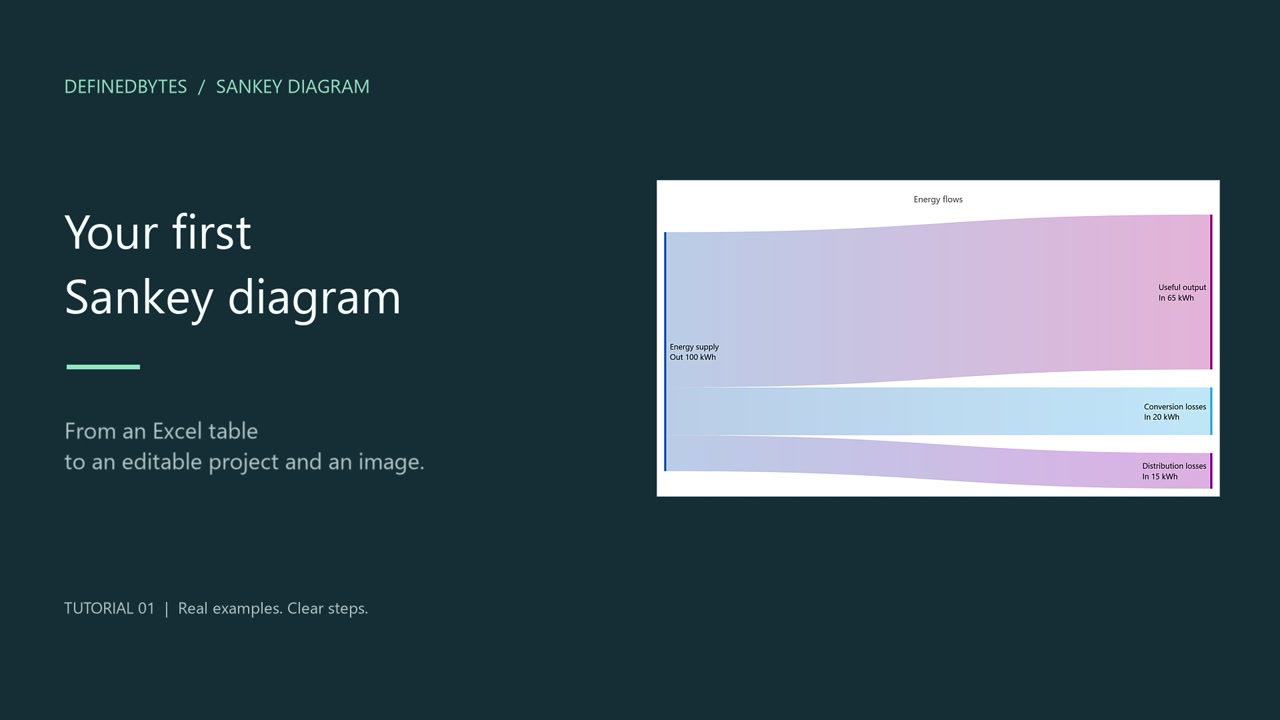
Import a flow table, correct values, add readable labels, and save both an editable project and a presentation image.
This video is hosted on YouTube. To watch here, enable Functional, Analytics and Advertisement cookies in Cookie preferences, or use the YouTube link.
Steps at a glance
Practice: energy-flows.xlsx · Flows worksheet
- Open energy-flows.xlsx, review the Connections layout and map Source, Target, Value and Note. Import, then choose Update diagram.
- Change the values to 65 / 20 / 15 and update again. Add the title, Name and values labels, and kWh as the unit.
- Save the editable .sad project, then export a PNG using Presentation 16:9.
02. Refresh a report from saved Excel data
2:30 · English narration and captions
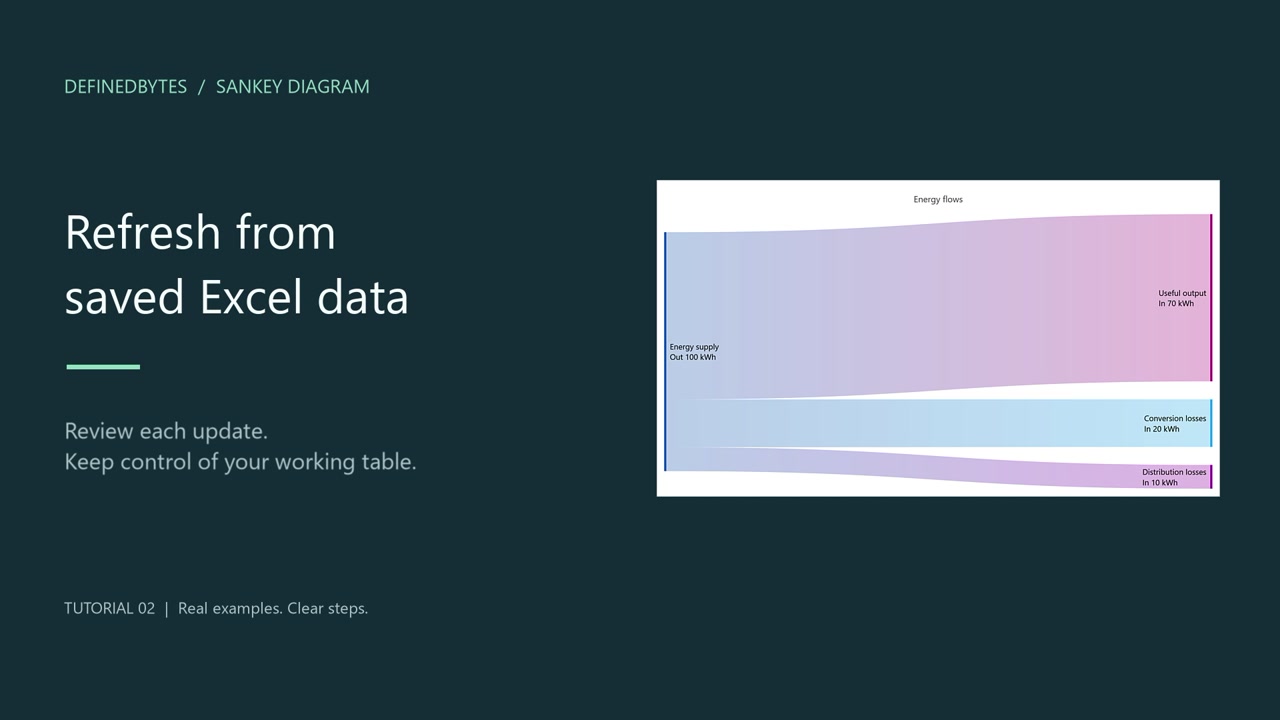
Remember a source workbook, review its saved changes, and refresh the report while keeping the title and appearance.
This video is hosted on YouTube. To watch here, enable Functional, Analytics and Advertisement cookies in Cookie preferences, or use the YouTube link.
Steps at a glance
Practice: A working copy of energy-flows.xlsx
- Import a working copy of the energy workbook with Remember this file for future reloads. Keep the title and unit, then save the .sad project.
- Change the workbook values to 70 / 20 / 10 in Excel. Save and close it, then choose Data source → Reload from source.
- Review and confirm the replacement. The diagram redraws. Use Undo or Redo if needed, update after those changes, then save.
03. Build routes across stages: Sum or Count
2:38 · English narration and captions
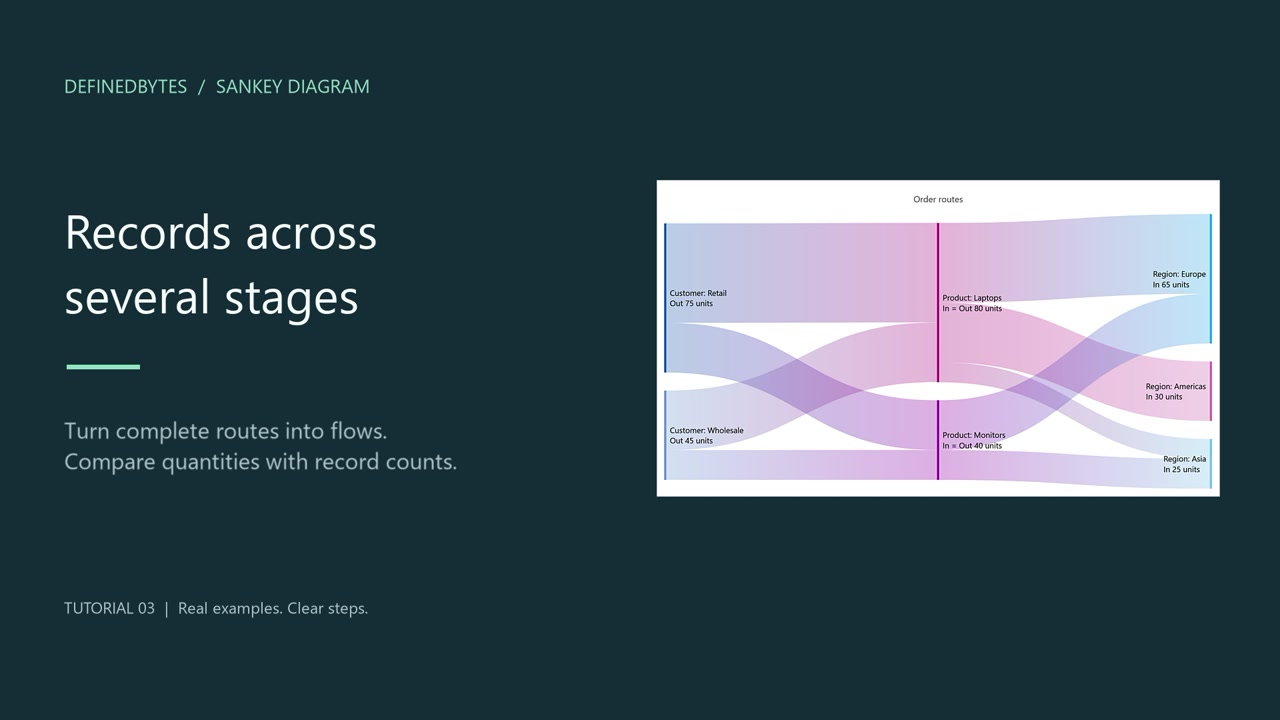
Map Customer, Product and Region, keep the original records editable, and compare quantities with the number of records.
This video is hosted on YouTube. To watch here, enable Functional, Analytics and Advertisement cookies in Cookie preferences, or use the YouTube link.
Steps at a glance
Practice: order-routes.xlsx · Orders worksheet
- Import order-routes.xlsx as Records across stages. Choose Customer → Product → Region, Sum of values and the Value column.
- Preview five records and an input sum of 120. Import, update the diagram, then set the title and unit.
- Use Stage data → Change stages / measure to switch to Count rows. Update and check an input count of five. Undo restores Sum and its unit.
Follow along with the practice files
Use the same fictional Excel data as the tutorials. The download includes two starting workbooks, completed .sad projects, exported diagrams and instructions for all three lessons.
ZIP · 253 KB · Fictional example data
- Extract the ZIP before opening a workbook or project. Work on a copy so you can repeat a lesson.
- Start with PracticeFiles/README.md. Open an XLSX file in Excel; use Import Excel / CSV in Sankey. Open a finished .sad file with Open project.
- For tutorial 02, keep the project and workbook inside ExampleProjects/RecurringSource together when moving the folder.
The energy values are teaching examples, not typical efficiency figures. The route example contains five fictional records with an input sum of 120 units.
Three commands worth keeping separate
Import
Copy a file into the table. Remember the file only when you want to reload it later.
Reload from source
Read the saved file again, review the replacement and apply it to the local table.
Save project
Keep editable data and presentation settings in .sad. Changes are not written back to Excel.
Keep learning
Find answers about importing data, Excel reloads, totals and labels, or saving and export. The built-in Help explains the same commands in the app.